ModelTeller Q&As:
What is ModelTeller? |
What is the input? |
Which running mode to use? |
What is the output? |
What are the candidate models? |
What about running time? |
Is it accurate??
ModelTeller is a machine-learning algorithm optimized to predict the nucleotide substitution model that yields the most accurate branch-length estimates.
ModelTeller is implemented using a Random Forest algorithm, trained on thousands of datasets that range over a wide range of empirical properties. In the implementation of ModelTeller, the propensity of every substituion model is computed and given as an output. All you need to do is upload the alignment or multiple consecutive alignments within a file or inside the textbox. ModelTeller will read your input, compute the relevant features, and report the best and alternative models for each of the alignments. Following the prediction of the best model, ModelTeller computes the maximum-likelihood tree for the selected model and your input data.

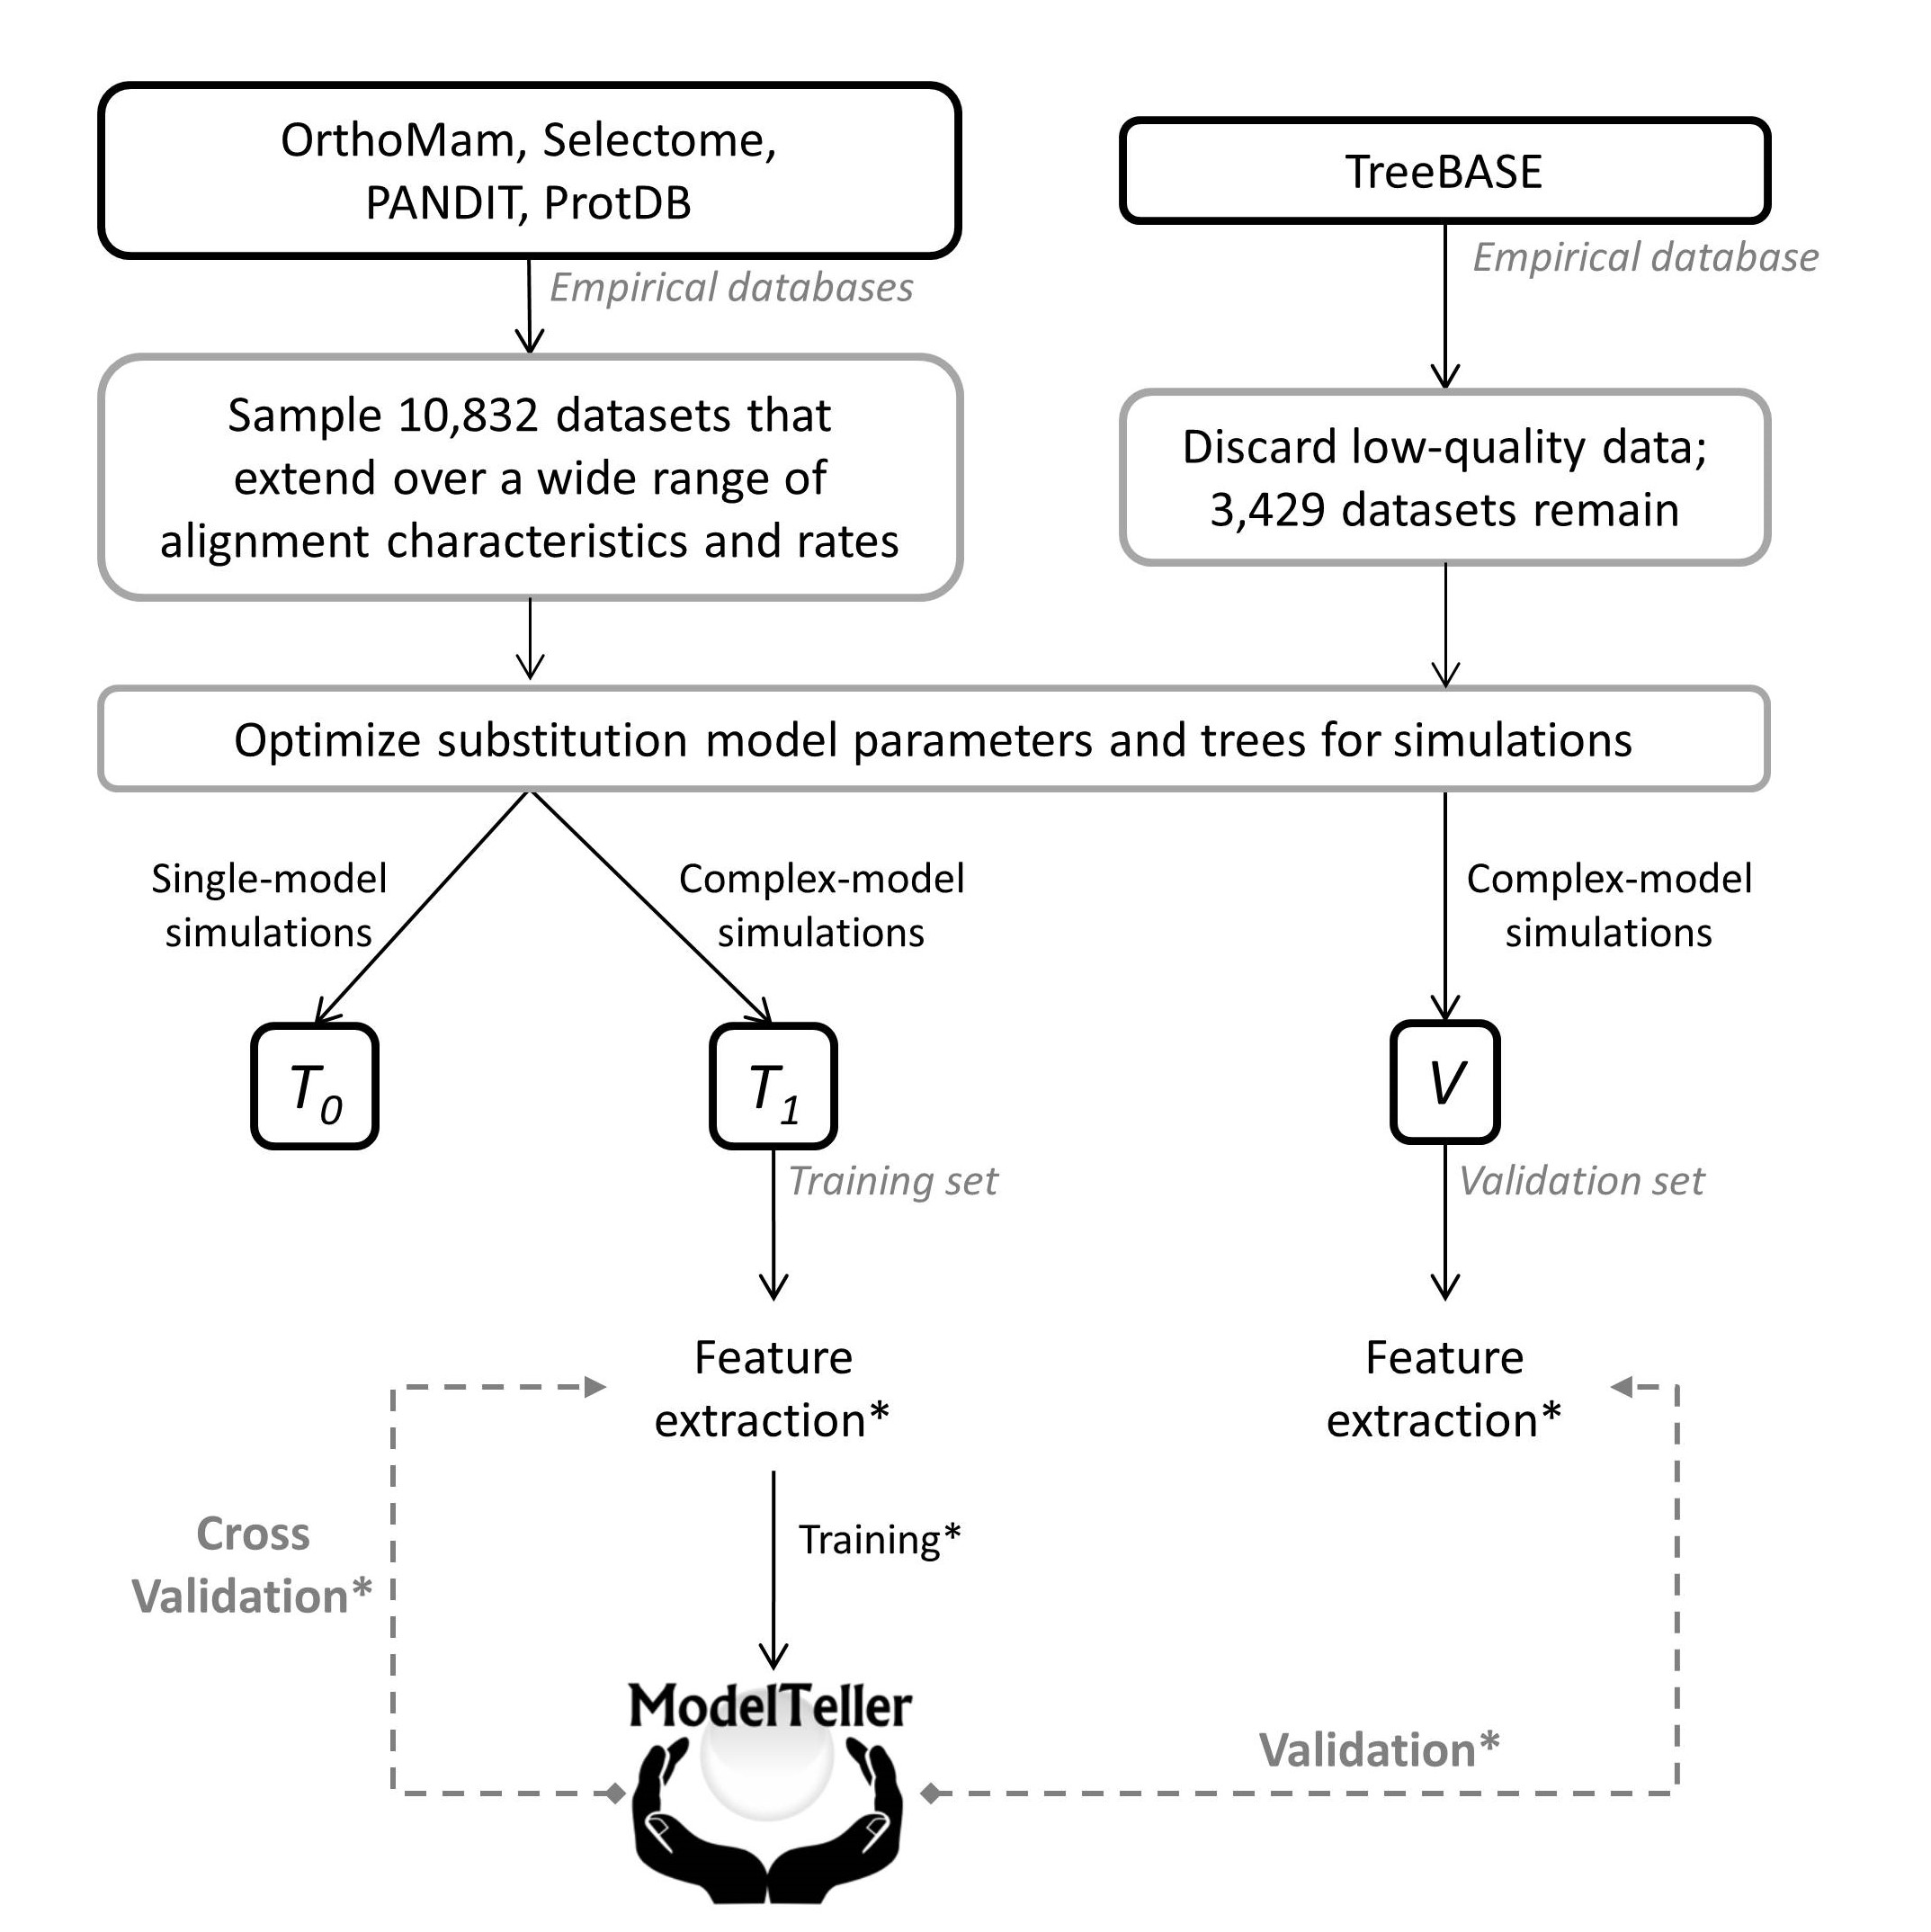
A schematic flowchart of the data and procedures applied for the study of ModelTeller. The black solid arrows represent the computational pipeline and the dashed grey arrows represent a prediction scheme, either cross-validation or validation procedures. Given an empirical sequence database, we first computed the optimized parameters for each of the 24 nucleotide substituion model. Given these parameters, simulations were made to generate the training/validation data and informative features were extracted from the simulated alignments. The features of the training set were used to train ModelTeller and assess its performance in cross-validation. The features of the validation set were used for assessing the predictions of ModelTeller. The asterisk represents procedures that were done once for the analysis of ModelTeller and once for ModelTellerG: for ModelTeller, the features were computed over a quick reconstruction of a BioNJ tree; for ModelTellerG, the GTR+I+G tree was first optimized, and the features were computed over this tree. The training and prediction were made according to the relevant sets of features. Click here for a quick view of the results!
Upload the alignment or multiple consecutive alignments within a file or inside the textbox.
Acceptable input can be any alignment file format that is valid in Biopython (listed below):
Only nucleotide sequences are valid. In case that ModelTeller could not read your input file, it would notify you with an appropriate error message.
ModelTeller will return the best model, and the ranking of alternative models among the following 24 nucleotide substitution models:
Whereas the statistical methods for phylogenetic reconstruction may take hours or even days of computation, ModelTeller retrieves results instantly!
Computation of the maximum-likelihood tree is done by PhyML after the best model is predicted and might take a little longer.
ModelTeller is optimized to retrieve the model that generates the most accurate branch-length estimates. ModelTeller was examined both in cross-validation on the training set T1 and on the validation set, V.
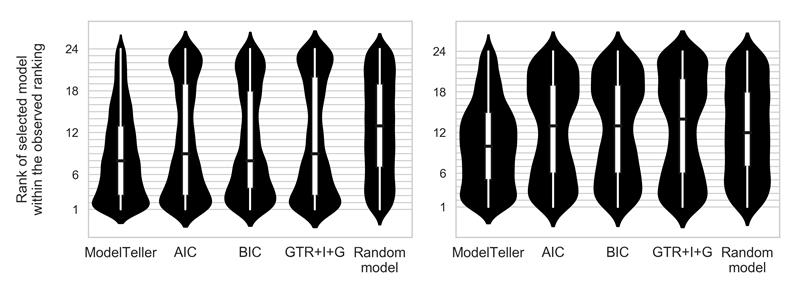
The figures below demonstrate ModelTeller's performance compared to AIC, BIC, using the most complex model, GTR+I+G, consistently, and selecting a model at random for each dataset.

Distribution of the true ranks of the selected models. The x axis represents five methodologies for model selection: ModelTeller, AIC, BIC, consistently using the GTR+I+G model, and selecting a model at random for each datasets. The y axis represents the true ranks (from 1 to 24) of the models selected by the methodologies according to the observed branch-length error (where 1 and 24 represnt the most and least accurate models, respectively). Left panel: distribution over the T1 set with medians: 8 for ModelTeller and BIC, 9 for AIC and GTR+I+G, and 13 for a random selection of model. Right panel: distribution over V with medians: 10 for ModelTeller, 13 for AIC, BIC, and for a random selection of model, and 15 for GTR+I+G. The black horizontal lines represent the medians, the thick white bars represent the interquartile (IQR) range, and the thin white lines extend beyond 1.5*the IQR range. The violin plots represent a kernel density estimation of the underlying distribution of the true rank of the selected models; wider sections of the violin plot represent a higher probability that the methodology selects models of that rank while skinnier sections represent a lower probability.
What is ModelTeller?
ModelTeller is a machine-learning algorithm optimized to predict the nucleotide substitution model that yields the most accurate branch-length estimates. ModelTeller is implemented using a Random Forest algorithm, trained on thousands of datasets that range over a wide range of empirical properties. In the implementation of ModelTeller, the propensity of every substituion model is computed and given as an output. All you need to do is upload the alignment or multiple consecutive alignments within a file or inside the textbox. ModelTeller will read your input, compute the relevant features, and report the best and alternative models for each of the alignments. Following the prediction of the best model, ModelTeller computes the maximum-likelihood tree for the selected model and your input data.

A schematic flowchart of the data and procedures applied for the study of ModelTeller. The black solid arrows represent the computational pipeline and the dashed grey arrows represent a prediction scheme, either cross-validation or validation procedures. Given an empirical sequence database, we first computed the optimized parameters for each of the 24 nucleotide substituion model. Given these parameters, simulations were made to generate the training/validation data and informative features were extracted from the simulated alignments. The features of the training set were used to train ModelTeller and assess its performance in cross-validation. The features of the validation set were used for assessing the predictions of ModelTeller. The asterisk represents procedures that were done once for the analysis of ModelTeller and once for ModelTellerG: for ModelTeller, the features were computed over a quick reconstruction of a BioNJ tree; for ModelTellerG, the GTR+I+G tree was first optimized, and the features were computed over this tree. The training and prediction were made according to the relevant sets of features. Click here for a quick view of the results!
Input sequence data
Upload the alignment or multiple consecutive alignments within a file or inside the textbox.
Acceptable input can be any alignment file format that is valid in Biopython (listed below):- Clustal - output from Clustal W or X.
- Emboss - EMBOSS tools' "pairs" and "simple" alignment formats.
- Fasta - the generic sequence file format where each record starts with an identifier line starting with a ">" character, followed by lines of sequence. Note that multiple alignments are not acceptable in this format.
- Ig - the IntelliGenetics file format, apparently the same as the MASE alignment format.
- Mauve - output from progressiveMauve/Mauve.
- Nexus - output from NEXUS.
- Phylip/phylip-sequential/phylip-relaxed.
- Stockholm - a richly annotated alignment file format used by PFAM.
Only nucleotide sequences are valid. In case that ModelTeller could not read your input file, it would notify you with an appropriate error message.
Running modes
- Select the best model for branch-lengths estimation (ModelTeller) - this option will rapidly select a single model for maximum-likelihood phylogeny reconstruction. The maximum-likelihood phylogeny, i.e., the model parameters, the branch-lengths, and the topology will be optimized for you after the model is predicted.
- Use a fixed GTR+I+G topology (ModelTellerG) - this option will first optimize the GTR+I+G phylogeny and then predict the optimal model for branch-length estimation. The maximum-likelihood phylogeny will be optimized given the GTR+I+G fixed topology. Prediction of the best model might take a little while due to the preliminary GTR+I+G phylogeny reconstruction, but the final tree will be computed rapidly. This procedure was demonstrated to perform best both for topologies and branch-length estimation accuracies on complex simulation models.
- User defined topology - if you have a good, validated topology for your data, please provide it and ModelTeller will predict the best model for branch-length estimation. The maximum-likelihood phylogeny will be computed for you given your fixed topology. In case you provided multiple alignments, multiple trees should be provided in the input file, each in a separate line. The input tree should be in Newick format and the IDs of the tips must match the IDs in the sequence alignment.
Output
-
1. The best predicted model and the ranking of alternative models, in case that you cannot use the best model in a downstream application.
2. The maximum-likelihood tree, reconstructed using the best model.
3. Interested in the features that led to this prediction? If you check the "Compute features contribution" checkbox, a csv file will be available for download after the tree is computed. Each entry in the file represents the weight of a single feature in computing the probability of choosing one model, as extracted from the paths along the Random Forest implementation.
The substitution models
ModelTeller will return the best model, and the ranking of alternative models among the following 24 nucleotide substitution models: - Jukes and Cantor 1969 (JC)
- Felsenstein 1981 (F81)
- Kimura two parameters 1980 (K2P)
- Hasegawa-Kishino-Yano 1985 (HKY)
- The generalized symmetrical model, Zharkikh, 1994 (SYM)
- General Time Reversible, Tavare 1986 (GTR)
Running time
Whereas the statistical methods for phylogenetic reconstruction may take hours or even days of computation, ModelTeller retrieves results instantly!
Computation of the maximum-likelihood tree is done by PhyML after the best model is predicted and might take a little longer.
ModelTeller accuracy
ModelTeller is optimized to retrieve the model that generates the most accurate branch-length estimates. ModelTeller was examined both in cross-validation on the training set T1 and on the validation set, V.
The figures below demonstrate ModelTeller's performance compared to AIC, BIC, using the most complex model, GTR+I+G, consistently, and selecting a model at random for each dataset.

Distribution of the true ranks of the selected models. The x axis represents five methodologies for model selection: ModelTeller, AIC, BIC, consistently using the GTR+I+G model, and selecting a model at random for each datasets. The y axis represents the true ranks (from 1 to 24) of the models selected by the methodologies according to the observed branch-length error (where 1 and 24 represnt the most and least accurate models, respectively). Left panel: distribution over the T1 set with medians: 8 for ModelTeller and BIC, 9 for AIC and GTR+I+G, and 13 for a random selection of model. Right panel: distribution over V with medians: 10 for ModelTeller, 13 for AIC, BIC, and for a random selection of model, and 15 for GTR+I+G. The black horizontal lines represent the medians, the thick white bars represent the interquartile (IQR) range, and the thin white lines extend beyond 1.5*the IQR range. The violin plots represent a kernel density estimation of the underlying distribution of the true rank of the selected models; wider sections of the violin plot represent a higher probability that the methodology selects models of that rank while skinnier sections represent a lower probability.